Central Tendencies
The most popular summary artifacts for a numerical variable in descriptive statistics are the mean, median, and mode which form Central Tendencies, - the initial artifacts for any data analysis.
Typical examples for such calculations include; marks of students in a class. Height and/or weight of new born children etc..
Central tendency calculations depict the central or the typical value of the distribution.
Exercise
Here is the link to the data on the people who boarded the Titanic ship. Download the data and open the file using JupyterLab.
If you have not yet downloaded Anaconda or have JupyterLab, follow instructions from here: http://ebooks.mobibootcamp.com/python/setup.html
Once you open the file, look into the various columns. In particular let us now look into the age column.
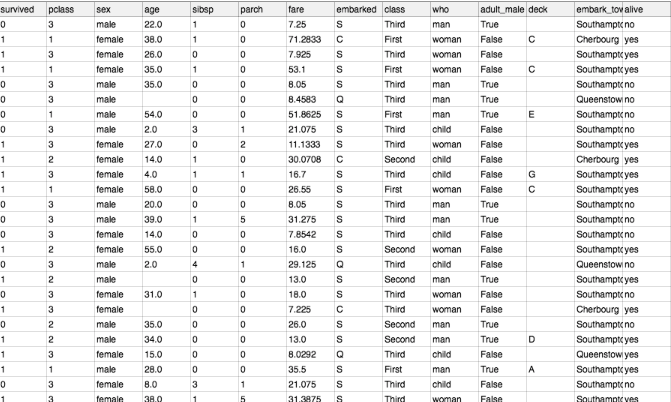
We will take the sample of the first 20 records for calculating our statistic. Note that the 6th record and the 17th and 19th records have no age information. We will skip those records for now and analyze only 17 values:
age = 22, 38, 26, 35, 35, 54, 2, 27, 14, 4, 58, 20,3 9, 14, 55, 2, 31
Mean
Mean of a set of numbers is the sum of numbers divided by the total. So to find the mean age of passengers in titanic on this sample of 17 records you would code:
ages = [22, 38, 26, 35, 35, 54, 2, 27, 14, 4, 58, 20, 39, 14, 55, 2, 31]
print("mean = ", sum(ages)/len(ages))
Output: mean = 28
The mean age of passengers is 28 on the sample. With this we uncovered the first metric on the data!
There are many other types of mean used when more data is present:
- Weighted mean - certain values are given more weitage when calculating mean
- Trimmed mean - a small designated percentage of the largest and smallest values (outliers) before calculating the mean
- Geometric mean - nth root of the product of all the values. Used in finance to calculate average annual return over a length of time.
Median
Median of a set of numbers is the value lying at the midpoint of the distribution, such that there is an equal numbers above or below that number. If the set of numbers is an odd number then the median is exactly the middle number. If the set of numbers is even then the median is the mean of the middle two numbers. To find the median first you have to sort the values and then you have to find the median. Python libraries provide us a sort method on list which sorts the list elements in ascending order in-place, and we will use that. Here is the code:
ages = [22,38,26,35,35,54,2,27,14,4,58,20,39,14,55,2,31]
ages.sort()
print(ages)
[2, 2, 4, 14, 14, 20, 22, 26, 27, 31, 35, 35, 38, 39, 54, 55, 58]
To find the median, since we have odd number of values, we take the middle value of the sorted list. From the above listing you can see that 27 is the middle value. There are 8 numbers before this number and 8 numbers after this number in the sorted list. Even though for this data, we could find that manually, in large data, you have to write a program and here is the generic program which works for both odd and even number of values:
ages = [22, 38, 26, 35, 35, 54, 2, 27, 14, 4, 58, 20, 39, 14, 55, 2, 31]
ages.sort()
# we use the // operator to get the integer midpoint and not decimal
midpoint = len(ages) // 2

if len(ages) % 2 == 1:
    print(ages[midpoint])
else:
    midpoint_left = midpoint-1
    print(ages[midpoint_left] + ages[midpoint]/2)
Output:
27
The median age of the passengers is 27. YAY! we found one more important metric of our data!
In this particular sample both median and mean are very close by. But sometimes you have a big difference between median and mean values. Why is that? If the mean and median values are vastly different then which metric is more indicative of the real middle point?
Mean or median? which one is more indicative of central tendencies?
In the Titanic example, the age column does not have extreme outliers. An outlier is a data value that deviates markedly from other data values in the sample. However let us take the example of sample salaries of people in a city;
salaries = [35k, 45k, 40k, 38k, 48k, 32k, 1million]
mean: 143,095 median: 40,000
In the above sample, you notice that almost all salaries are below 50k except one salary which is 1 million. If you are asked to give the typical value of salaries in this city, would you choose mean or median?
If your answer is median then you are correct! Median depicts the typical values of salaries in this city and not mean. By adding the outlier; 1 million, the mean is far away from the typical value.
While the median is immune to outliers, mean is susceptible to both minimum and maximum values in the data. That is why in all salary surveys that you see in the news paper and other articles, you see median values mentioned and not mean.
Note: In the above example, you could run your statistic on the entire data instead of using the first 20 records. First 20 records are shown to keep the explanation simple.