Summary Statistics
While mean and median are more commonly calculated, there are a few other metrics that an analyst may be interested in. Collectively these are called Summary Statistics Summary statistics as the name implies, summarizes the values in a few different ways to get a better understanding of the data. Typical summaries are; total count, the lowest value, the highest value, the mean, median, mode, standard deviation of the values etc..
From the sorted list of the previous example from the last chapter, you can add the below summaries to your list:
- Total number of records in the data set.
- Max age. In python you can use
max(ages)to get 58 - which represents the oldest traveller in our sample - Min age. In python you can use
min(ages)to get 2 - a toddler as the youngest person in our sample.
Note: In the above example, you could run your statistic on the entire data instead of using the first 20 records. First 20 records are shown to keep the explanation simple.
Mode
Mode depicts the value which is repeated the most. In our data on ages, we have three modes, 2, 14, 35. If no number is repeating in a list, then there is no mode for that series.
Range
Range is the difference between the minimum and the maximum values. In our sample date on age, the range is 58 - 2 = 56
Percentile
Percentile is a measure indicating the value below which a given percentage of observations in the data fall. For example, if your score in ACT is said to be in the 90th percentile then 90% of the students who took the ACT test scored same as or lower than your score.
Quartiles
When you extend the median concept for the point at 25th percentile and 75th percentile then you get quartile values at 25th and 75th respectively. Median is when you find the quartile at 50th percentile. The 25th quartile is found one quarter of the way when the values have been arranged in ascending order; the 75th quartile is found at the point three quarters up. The inter-quartile range is found by subtracting the lower quartile from the upper quartile.
Standard Deviation (SD)
While the range provides the dispersion between minimum and maximum values, Standard Deviation is a measure that summarises the amount by which every value varies from the mean (a.k.a variability). Basically SD measures the spread. Low SD indicates, lesser spread, and SD will be close to zero in such cases. Higher SD value indicates data values are spread out on a wider range of values.
SD is the most popular and widely used measure of dispersion. Unlike the range and inter-quartile range, it takes into account every variable in the data.
Formula for finding σ the Standard Deviation on the population :
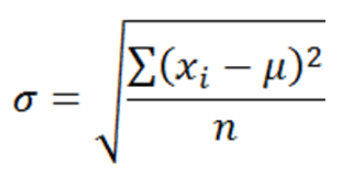
where xi is the individual value of every single data in the dataset, μ is the mean and n is the total number of values. Basically add the difference between every single value and the mean and divide by the total number of values. The computation of this formula gives the SD.
Note: Standard Deviation on sample data is calculated differently. This is because as per Jensen's inequality, calculating SD the standard way on sample will result in underestimate. Hence to correct that you divide the variable by n-1 instead of n. The revised formula would be:
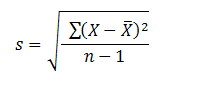
where x̄ represents the mean of the sample and n is the total number in the sample. Since in statistics, you mainly use samples instead of population, you would find the second formula applied more frequently.
So in summary the symbols that you should be aware of:
Statistic (sample):
- Mean: x̄
- Spread (Standard Deviation): s
Parameter (population):
- Mean: μ
- Spread: (Standard Deviation): σ
Standard Deviation and Range are sensitive to outliers just like mean. In most of the cases, outliers are an anomaly and should be removed from calculations. Before removing however, significant amount of research should be conducted to conclude that it is indeed an erroneous data.
In our Titanic data we do not see any outliers for the age column with unit of measurement in years. A valid minimum value would be a positive decimal close to 0 and the maximum value could be close to 100. However hypothetically, if you see any value which is in negative or over 150 as the age, then you can conclude that to be erroneous data and remove from calculations.
Summary Statistics is many a times shown with a box-whisker plot.