Skewness
Skewness is a measure of asymmetry of the frequency distribution around the mean. The skewness value can be positive, zero, negative, or undefined. Negative skew indicates that the tail is on the left side of the distribution, and positive skew indicates that the tail is on the right.
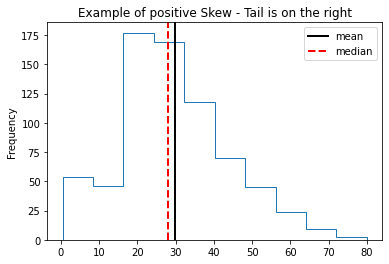
In the titanic dataset, the age distribution is having a positive skew as the tail is on the right.
import matplotlib.pyplot as plt
age = df['age'].dropna()
ax = age.plot(kind='hist', histtype='step', title='Example of positive Skew - Tail is on the right')
plt.axvline(age.mean(), color='k', linestyle='solid', linewidth=2, label="mean")
plt.axvline(age.median(), color='r', linestyle='dashed', linewidth=2, label="median")

labels = ["mean", "median"]
handles, _ = ax.get_legend_handles_labels()

# Slice list to remove last handle
plt.legend(handles = handles[:-1], labels = labels)
A zero skew value indicates that the tails on both sides of the mean balance out. This typically happens when the mean, median and mode have the same value. It can also happen when the tail on one end is thin and long and the other end it if fat and short.
For positive skew, you see the mean line to the right of median and mode, although that is not the a requirement to be considered as a positive skew.