Correlation
Correlation is a statistical technique using which you show if there is any relationship between pairs of variables. Correlation is measuring the relationship between two variables all else being equal.
Positive Correlation
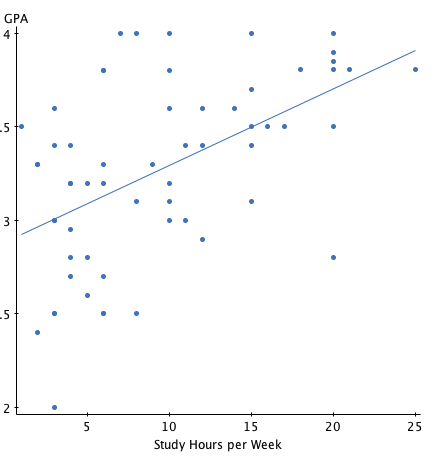
A pair of variables are positively correlated when the measure of one increases then the measure of other also increases. Here is an example;
- If students study well, they improve their GPA. You define this as - amount of time spend on studies has a positive correlation with student GPA. To show this correlation you can show a scatter plot with Study hours/week on the x-axis and GPA on the y-axis as shown below.
Negative Correlation
Correlation can also be negative when the measure of one increases the other decreases. Here is an example;
- If students skip classes, their GPA's go down. Again with observations plotted on a graph you can show this relationship.
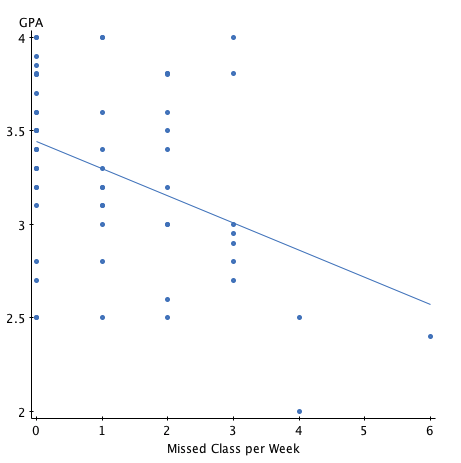
Both the plots above have a linear regression line drawn for the points. A regression line is nothing but the best-fitting straight line through the points.
While covariance or correlation is plotted with absolute values, we are more interested in calculating the correlation co-efficients as it brings the measurements to a more manageable range of 1 to -1. Where, a correlation co-efficient of 1 means high positive correlation and a value of -1 means high negative correlation. A value of 0 means no correlation. Anything from 0 to 1 is weak to high positive correlation and 0 to -1 is weak to high negative correlation. More on that here: https://www.surveysystem.com/correlation.htm
Interactive diagram to plot the best fitting line: http://www.shodor.org/interactivate/activities/Regression/