Types of Data
Broadly the data under analysis can be classified as:
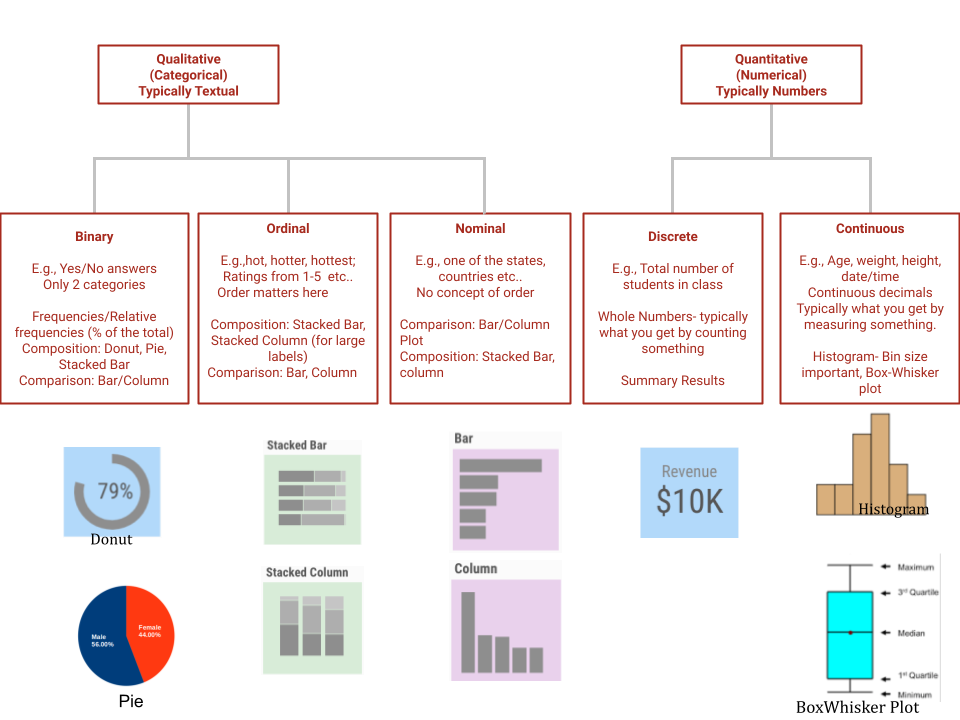
Categorical data types are also called Qualitative. Although most categorical data are qualitative and hence are textual values, you may even have numerical values which are in disguise as quantitative but are actually qualitative. E.g., zip codes.
Plots with Multi Variants
While the above picture shows the various plots and graphs with a single variable and its associated distributions, there will be many insights formed by finding relationships between variables. Here are some typical plots on such relationships:
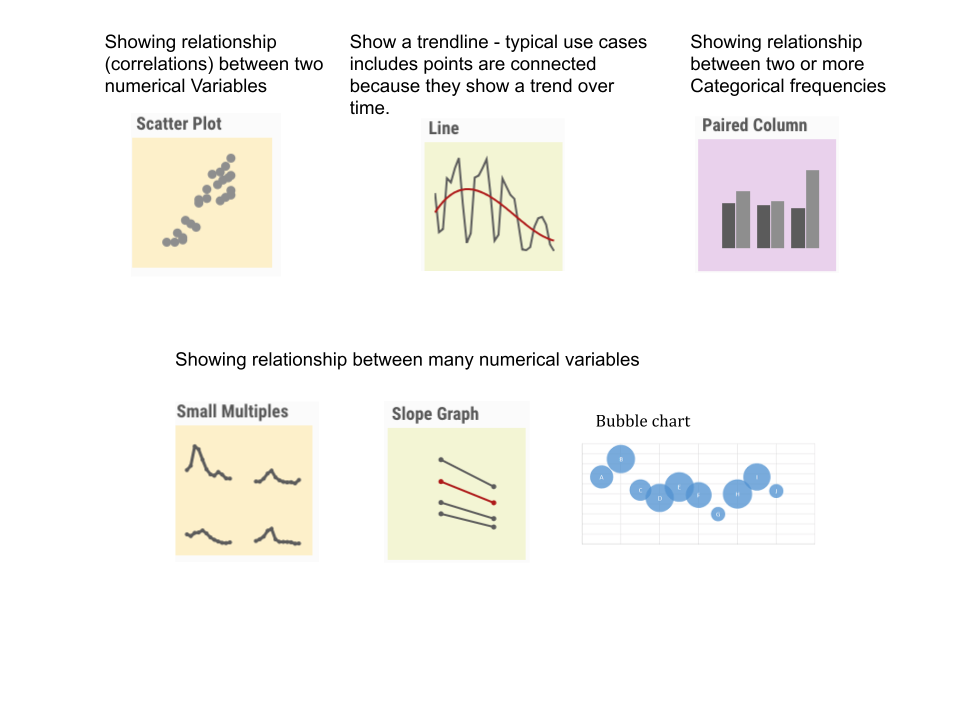
Examples for Scatter Plot
- Plot of the value of the house price vs the age of the owner when the house was purchased.
- Plot the value of Math score vs English score in SAT.
Examples for Line Chart
- Daily increase in COVID cases - plot the number of cases on 'y' axis to date in the 'x' axis
- Stock price increase over day/time
- Pareto diagram
Examples for relationship between categorical frequencies
- Quarterly sales of Ford vs GM cars - basically compare the total sales figure of two or more products per quarter, year etc..
- Real estate sales count across multiple states for a given month, quarter etc..