What is EDA?
Get me some insights from this data
is one of the typical task that a budding Data Analyst gets assigned. The business that asks this typically has sufficient data collected from customers (both internal and/or external) or manufacturing/production related data entries, customer satisfaction surveys, marketing campaign results or any other varied type of data, which are of business interest and they would like to improve their services by adding more value to end users perhaps or improve their profit margin by taking right decisions to gain competitive advantage, based on trends hidden in the data. That is when they need a Data Analyst!
A Data Analyst then collects, organizes and interprets data using statistical methods and translates the data into meaningful insights which can drive the business. The explanatory artifacts they create from raw data helps the business take important decisions by identifying important facts and trends which were hidden and were not obvious by simply looking at the raw data.
Typical steps that a Data Analyst might take:
- Performs initial analysis to assess the quality of the data.
- Removes dirty data as and when discovered.
- Performs Exploratory Data Analysis (EDA) to determine the meaning of the data.
- Presents the findings with Explanatory Diagrams, Summaries and Narratives to the management.
Typical initial questions to start with:
- How data is distributed?
- How variables are correlated?
Key skills required to accomplish this task:
- Ability to start with an unknown/unfamiliar data set with high level of curiosity.
- Identifies dirty data to remove by confirming its irrelevance by asking questions on the data source.
- Aware of statistical techniques to apply on data.
- Has a high level of attention to detail and accuracy.
- Interpersonal skills.
- Team working skills.
- Written and verbal communication skills.
EDA History
EDA - Exploratory Data Analytics is a technique of informal study of data, first introduced by John Tukey in 1977 and subsequently adopted and augmented by many others over the years. The results of an EDA is discovering a hypothesis which may be presented, using one or more of the two types of artifacts:
- Pictures - graphs, plots etc., using standard statistical diagrams like Histogram, Bar chart, Scatter plot etc..
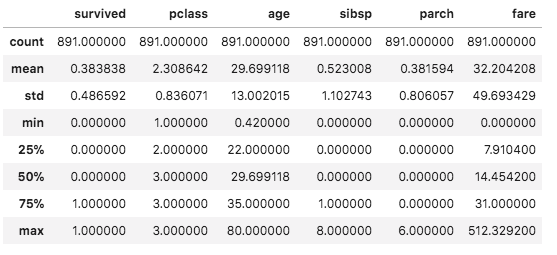
- Numerical Inferences - using summary statistics; finding mean, median, minimum, maximum, standard deviation etc.
EDA Goals
The goal of an EDA is to listen to data to:
- Unearth interesting correlations between variables
- Identify outliers, patterns or anomalies.
- Finally conclude with your own hypothesis if there exists one, using narratives to form a story.
In the final form, the raw data would have been sifted through a few times to unearth some interesting facts which are presented through explanatory diagrams and narratives.
With an EDA approach, a plausible model is not applied on the data first, instead, we allow the data to reveal its underlying structure and model. Once data is visualized, then you can formulate a hypothesis. This technique is in contrast with the standard inferential statistical hypothesis testing. In the standard hypothesis testing, you already have a hypothesis and you want to test your hypothesis on the given data. Before making inferences from data it is essential to know all the variables. That is where EDA comes to aid. In EDA you discover a hypothesis (if there is one) from data, based on your summaries and the visualizations you generate.
After an EDA session an analyst may in fact have more questions than answers even though many initial questions were answered. Many a times an EDA session leads to more data collection and more analysis to better understand and could also lead to hypothesis testing using sophisticated inferential statistical models.
Results of EDA
- At the end of the EDA session you finally get familiar with the data
- Exploratory phase concludes with an Explanatory phase consisting of Diagrams, Numerical Inferences and Narratives.
- You know which variables to focus on and which variables to ignore.
- You made grounds for further hypothesis testing and provide a direction for extrapolating the findings with more data.
- You made grounds for applying Machine Learning (ML) models to help form decisions and/or actions
What Are An Analysts Traits?
Since EDA is applied without any preconceived bias or notion, an Analyst should address the data with an open mind. Many a times the Analyst will have no clue about the variables (a.k.a features) or their relationships.
A good analyst will have a cursory glance at the data with the following qualities:
- Starts with an initial question and tries to find an answer. Then again asks more questions till (s)he is reasonably satisfied with the answers which are dug out.
- Is not afraid and has perseverance to follow this procedure for several iterations.
- Is curious and skeptical about the data that is presented.
- Is willing to play around with data and numbers and arrive at one's own conclusion
- Identifies oddities in the data through visualization and summaries
- Creates narratives and tells an engaging story about the data
EDA technique most often spring a surprise about the data under study and could lead to unexpected conclusions and correlations. The more meaningful diagrams you produce, the better you understand the data.
Case Study Hurricane Frances and the Opportunity seen by the Wal-Mart CIO
This article was originally published in New York times 2004
Hurricane Frances was on its way, barreling across the Caribbean, threatening a direct hit on Florida’s Atlantic coast. Residents made for higher ground, but far away, in Bentonville, Ark., executives at Walmart Stores decided that the situation offered a great opportunity for one of their newest data-driven weapons … predictive technology.
A week ahead of the storm’s landfall, Linda M. Dillman, Wal-Mart’s chief information officer, pressed her staff to come up with forecasts based on what had happened when Hurricane Charley struck several weeks earlier. Backed by the trillions of bytes’ worth of shopper history that is stored in Wal-Mart’s data warehouse, she felt that the company could ‘start predicting what’s going to happen, instead of waiting for it to happen,’ as she put it. (Hays, 2004) Consider why data-driven prediction might be useful in this scenario. It might be useful to predict that people in the path of the hurricane would buy more bottled water. Maybe, but this point seems a bit obvious, and why would we need data science to discover it? It might be useful to project the amount of increase in sales due to the hurricane, to ensure that local Walmarts are properly stocked. Perhaps mining the data could reveal that a particular DVD sold out in the hurricane’s path—but maybe it sold out that week at Walmarts across the country, not just where the hurricane landing was imminent. The prediction could be somewhat useful, but is probably more general than Ms. Dillman was intending.
It would be more valuable to discover patterns due to the hurricane that were not obvious.To do this, analysts might examine the huge volume of Walmart data from prior,similar situations (such as Hurricane Charley) to identify unusual local demand for products. From such patterns, the company might be able to anticipate unusual demand for products and rush stock to the stores ahead of the hurricane’s landfall. Indeed, that is what happened. The New York Times (Hays, 2004) reported that: “… the experts mined the data and found that the stores would indeed need certain products and not just the usual flashlights.‘We didn’t know in the past that strawberry Pop-Tarts increase in sales, like seven times their normal sales rate, ahead of a hurricane,’ Ms. Dillman said in a recent interview. 'And the pre-hurricane top-selling item was beer'
Case Study Conclusion
- Wal-Mart uncovered a very useful insight from its historic data
- Wal-Mart did not have any known Hypothesis for increased sale of Strawberry Pop Tart but they did have a Hypothesis on increased bottled water sales
- Business not only gets additional supply of Strawberry pop tarts but also stacks it next to bottled water so the customer can reach for both quickly.
- EDA is all that is required in this case study.
Real World Examples of EDA
OSEMN (Pronounced as Awesome) in EDA
A popular data science pipeline is called "OSEMN" which stands for:
- Obtaining the data is the first step.
- Scrubbing or cleaning the data is the second step. Refer Chapter - Data Cleaning for details.
- Exploring the data using descriptive statistical techniques is the third step. Looking for any outliers or anomaly in the data. Understanding the correlations between variables might be established by plotting correlation matrix/diagrams. Descriptive statistic techniques end with this step.
- Modeling the data follow next by applying Inferential Statistical techniques.
- INterpreting the data is last. This step will typically end with some actionable decisions.
With all the EDA and Hypothesis testing, what decisions or predictions can be made for the greater good? This is the final outcome of any data science pipeline.


