Pivot Tables and more
You can create spreadsheet-type pivot tables to help aggregate and present column data in different ways. Refer: https://pandas.pydata.org/pandas-docs/stable/reference/api/pandas.pivot_table.html
You can also refer to the melt function that provides a similar functionality: https://pandas.pydata.org/docs/reference/api/pandas.melt.html
Here is an example of using some of these functions. Create a simple dataframe with rows and columns as shown below:
df = pd.DataFrame({
                'county': ['Wayne', 'Oakland', 'Wasthenaw', 'Kent'], '2020-09-01':[5, 11, \
                10, 5], '2020-09-02':[10, 5, 9, 15], '2020-09-03':[4, 8, 12, 16]
                })

df.head()
Output:
    county    2020-09-01    2020-09-02    2020-09-03
0    Wayne        5             10            4
1    Oakland        11              5            8
2    Wasthenaw    10              9            12
3    Kent        5              15        16
Using melt: Now using melt, you can convert the columns values into a date column as shown below
df2 = df.melt(id_vars=['county'], value_vars=['2020-09-01', '2020-09-02', '2020-09-03'], value_name='count', var_name='date')
df2.head()
Output:
    county        date        count
0    Wayne        2020-09-01    5
1    Oakland        2020-09-01    11
2    Wasthenaw    2020-09-01    10
3    Kent        2020-09-01    5
4    Wayne        2020-09-02    10
While the above statement has hardcoded column values for value_vars variable, you can make it dynamic so that the columns are picked up based on the index positions in the df.columns index, shown in the expression below
df2 = df.melt(id_vars=['county'], value_vars=df.columns[1:4], value_name='count', var_name='date')
And now you can get the county values as column values by using the pivot_table as shown below:
df3 = df2.pivot_table(index=['date'], columns=['county'])
df3.head()
Output:
county        Kent        Oakland        Wasthenaw   Wayne
date
2020-09-01    5            11            10            5
2020-09-02    15            5            9            10
2020-09-03    16            8            12            4
Once we have in this format, we can now get a timeseries plot across all the dates in one statement as shown below:
ax = df3.plot()
ax.legend(bbox_to_anchor=(1.1, 1.05))
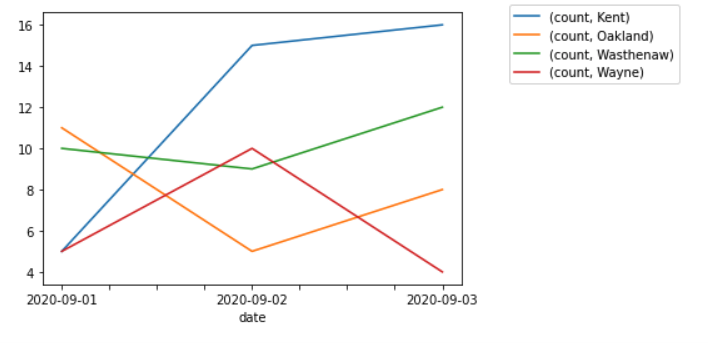
Notice the keyword arguments and the values that are used on the Matplotlib's AxesSubplot object that is returned from the plot() function
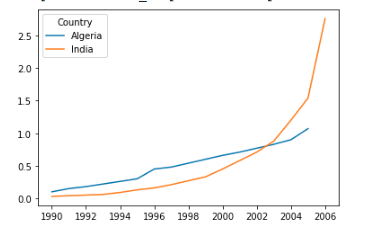
Example 2 using pivot_table
import pandas as pd

df = pd.read_csv('https://storage.googleapis.com/mbcc/datasets/pc_per_100.csv')

df.set_index('Country', inplace=True)
df2 = df.loc[['India', 'Algeria']]
df2
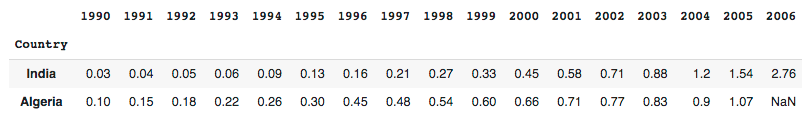
df2.pivot_table( columns=['Country']).plot()