Spark SQL
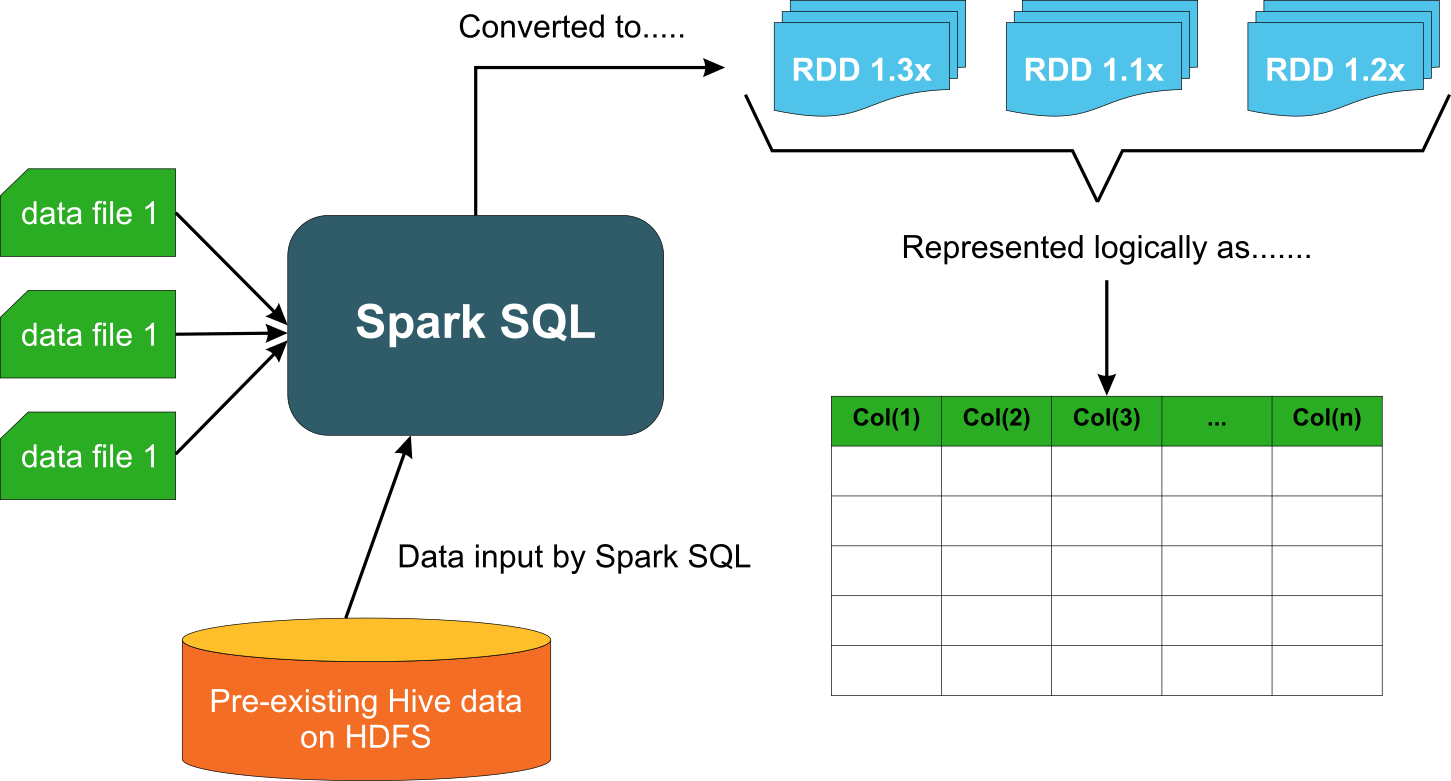
Spark SQL is a module that is built on top of Spark Core for structured data processing. Traditionally analytics was dealt using SQL. With Hadoop, it shifted to knowing Java programming which was not a comfort zone for traditional analysts who were savvy with SQL. So Spark SQL was a necessary add-on for spark and has become quite popular: 2/3rd's of Databricks Cloud (a hosted service running Spark) customers use Spark SQL
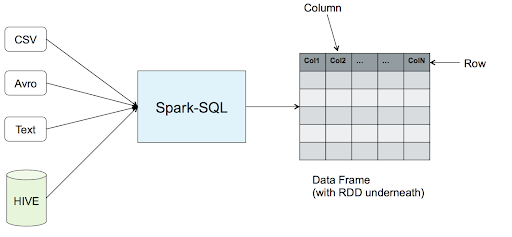
In Spark SQL, data is described as a DataFrame with rows, columns and a schema. Data manipulation in Spark SQL is available via SQL queries, the DataFrames API You can not only use SQL on RDD but also access other relational tables using Spark SQL
Reference: A comparative study of using RDD vs SparkSQL vs Spark DataFrame https://community.cloudera.com/t5/Community-Articles/Spark-RDDs-vs-DataFrames-vs-SparkSQL/ta-p/246547
Spark SQL: https://spark.apache.org/docs/latest/sql-getting-started.html
Cheat Sheet for Spark DataFrame API
| Description | Example | Function Def | |
|---|---|---|---|
| spark session | spark = SparkSession.builder.master("local").getOrCreate() | SparkSession.builder.master(url) | |
| distributed computing can be initiated after getting a session object. local represents [master](https://spark.apache.org/docs/2.1.3/api/java/org/apache/spark/sql/SparkSession.Builder.html#master(java.lang.String) connection to local spark instance and can be replaced with any other url connection for a spark cluster | |||
| read local json file into a dataframe | df = spark.read.json("examples/customers.json") | spark.read.json(filepath) | |
| use the session object to read a json file to create a dataframe. This example reads from local file system. Replace 'json' with 'csv' to read a csv file | |||
| read hdfs csv file into a dataframe | df = spark.read.csv("hdfs://examples/customers.csv") | spark.read.csv(filepath) | |
| expects a file called customers.csv in the examples folder on hdfs and returns a dataframe. If the values are separated other than comma use keyword argument 'sep'. e.g., sep=" " to process space seperated values. | |||
| summary statistics | df.describe() | ||
| returns summary statistics on numerical columns | |||
| print rows | df.show() | ||
| by default prints the top 20 rows. To get specific number use show(n) where n=numer of rows to display | |||
| rename a column | df.withColumnRenamed('oldname', 'newname') | df.withColumnRenamed(existing, new) | |
| rename just one column using this expression | |||
| drop duplicates | df.drop_duplicates() | ||
| drops duplicate records | |||
| change column labels | df.toDF('col1','col2') | toDF(*cols) | |
| returns a new dataframe with the new specified labels. The number of arguments should match the existing columns | |||
| derive or replace column | df.withColumn('colName', df.col2) | withColumn(str, ColumnObject) | |
if colName already exists it replaces the values with col2 else adds a new column. Typically the second argument is an expression like df.col2 * 10 where the values in col2 is multiplied by 10 and that value is set in 'colName' | |||
| get first row as row object | df.head() | head(n=None) | |
| by default returns the first row of the df as a Row object. If the optional number is given, it returns that many rows as a list of Row objects | |||
| get last row as row object | df.tail(1) | tail(num) | |
| this needs the argument which specifies how many rows to get as Row objects from the last | |||
| get some columns as a df | df.select(['col1','col2']) | select(*cols) | |
| returns a new dataframe with col1 and col2 only. however select can also take '*' which returns all columns or a Column object as well | |||
| get column object | df['col1'] or df.col1 | ||
| can apply expressions on this object. Reference | |||
| get datatype of columns | df.printSchema() or df.dtypes | ||
| prints the datatype of all columns | |||
| fill na for all na values | df.fillna(value) | fillna(value, subset=None) | |
| value can be int, float, string, boolean or dictionary. If the column does not support that datatype, it is simply ignored. If value is a dictionary see example below | |||
| fill na for specific columns | df.fillna({'col1':100, 'col2':false}) | ||
| in this case it will only address col1 and col2 with the given values in the dict | |||
| fill na alternative way | df.na.fill() | ||
| this is same as fillna | |||
| group by | df.groupby('col1') alias groupBy | groupby(*cols) | |
| returns GroupedData object | |||
| filter rows | df.filter(df.commercial_building == 'Yes').show() | filer(condition) alias where | |
| Returns a dataframe applying the given condition | |||
| spark context | sc = spark.sparkContext | sparkSession.sparkContext | |
| Using Spark Session, you can get the handle on Spark Context | |||
Cheat Sheet for GroupedData functions
gd is the GroupedData object obtained when groupby is run on a dataframe
| Functionality | Definition | Example | Description |
|---|---|---|---|
| find total count | count() | gd.count().show() | counts the number of records for each group and returns a dataframe |
| compute aggregates | agg(*exprs) | gd.agg({'price':'max', 'lon':'max'}).show() | returns a dataframe. 'exprs' is a dict mapping from column name (string) to aggregate functions (string), or a list of Column.aggregates. built in functions are avg, max, min, sum, count |
| sum numerical columns | sum(*cols) | gd.sum().show() | returns a dataframe by calculating the sum of all numerical columns. Non numerical columns are ignored |
| max value in numerical columns | max(*cols) | gd.max().show() | returns a dataframe by finding the max value of all numerical columns. Non numerical columns are ignored |
| min value in numerical columns | min(*cols) | gd.min().show() | returns a dataframe by finding the min value of all numerical columns. Non numerical columns are ignored |
| average value in numerical columns | avg(*cols) | gd.avg().show() | returns a dataframe by finding the mean value of all numerical columns. Non numerical columns are ignored |
References
- https://github.com/apache/spark/tree/master/examples/src/main/python
- https://www.databricks.com/spark/getting-started-with-apache-spark
Pandas API on Spark
Recently, Pandas API on Spark was released which enables you to convert your Pandas DataFrame to pandas-on-Spark DataFrame and thereby make use of distributed computing. Although in many situations you have to make some settings and/or code adjustments to get it working in Spark, it is still the best option you have when you need to run your Pandas Dataframe on Spark.
Reference: https://spark.apache.org/docs/latest/api/python/user_guide/pandas_on_spark/index.html
Colab Example
https://colab.research.google.com/drive/1bw9BQdftbCNZGKa_B1bPAjpY5l4oXprO